
The statistics are very useful when configuring sensors and setting up your hub, but for daily use we need a more contextual presentation of temperature readings, etc.
Use the following command to fetch the necessary website files:
wget -r -nH --cut-dirs=4 --reject "index.html*" -P /var/www/html/ -i /var/www/html/manifest3.txt http://www.warrensoft.co.uk/home-hub/manifests/website/manifest3.txt
Now you can refresh the website in your browser and choose the Current Values option.
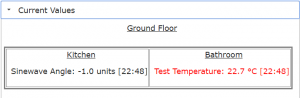
All Sensors, Actuators and Impulses are assigned to a zone, and will be displayed within that zonal box in this floor plan representation. You will want to make your display mimic the layout of your house, as far as possible.
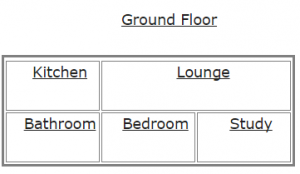
To achieve this each zone has X, Y and Z co-ordinates, with Z representing the floor number. In addition, each zone has Rowspan and Colspan values which enable the size of the zone to be adjusted relative to neighbouring zones. Anyone familiar with html table construction will quickly be able to model the rooms of their house (which is how the plan is drawn!). If not, then a drawing on squared paper will help. Here is an example:
| Zone Name | X | Y | Z | Rowspan | Colspan |
|---|---|---|---|---|---|
| Kitchen | 1 | 1 | 1 | 1 | 1 |
| Bathroom | 1 | 2 | 1 | 1 | 1 |
| Lounge | 2 | 1 | 1 | 2 | 1 |
| Bedroom | 2 | 2 | 1 | 1 | 1 |
| Study | 3 | 2 | 1 | 1 | 1 |
In the next post we will enable sampling, and see our sensor values displayed on a graph.